|
|
Regul@tionSpotterDocumentation |
| Documentation |
| Input | Output | Interaction Plot | vcf documentation | Contact |
| Examples |
| Examples & Tutorial |
Single Variant
For single queries in RegulationSpotter you can use the single query interface. Here, you can put in single variants as shown in our single query tutorial. Simply fill in the chromosome and location of the variant along with the reference and alternative allele. Please note that For InDels, you have to use the VCF format, i.e. always start with the last reference base before the variant.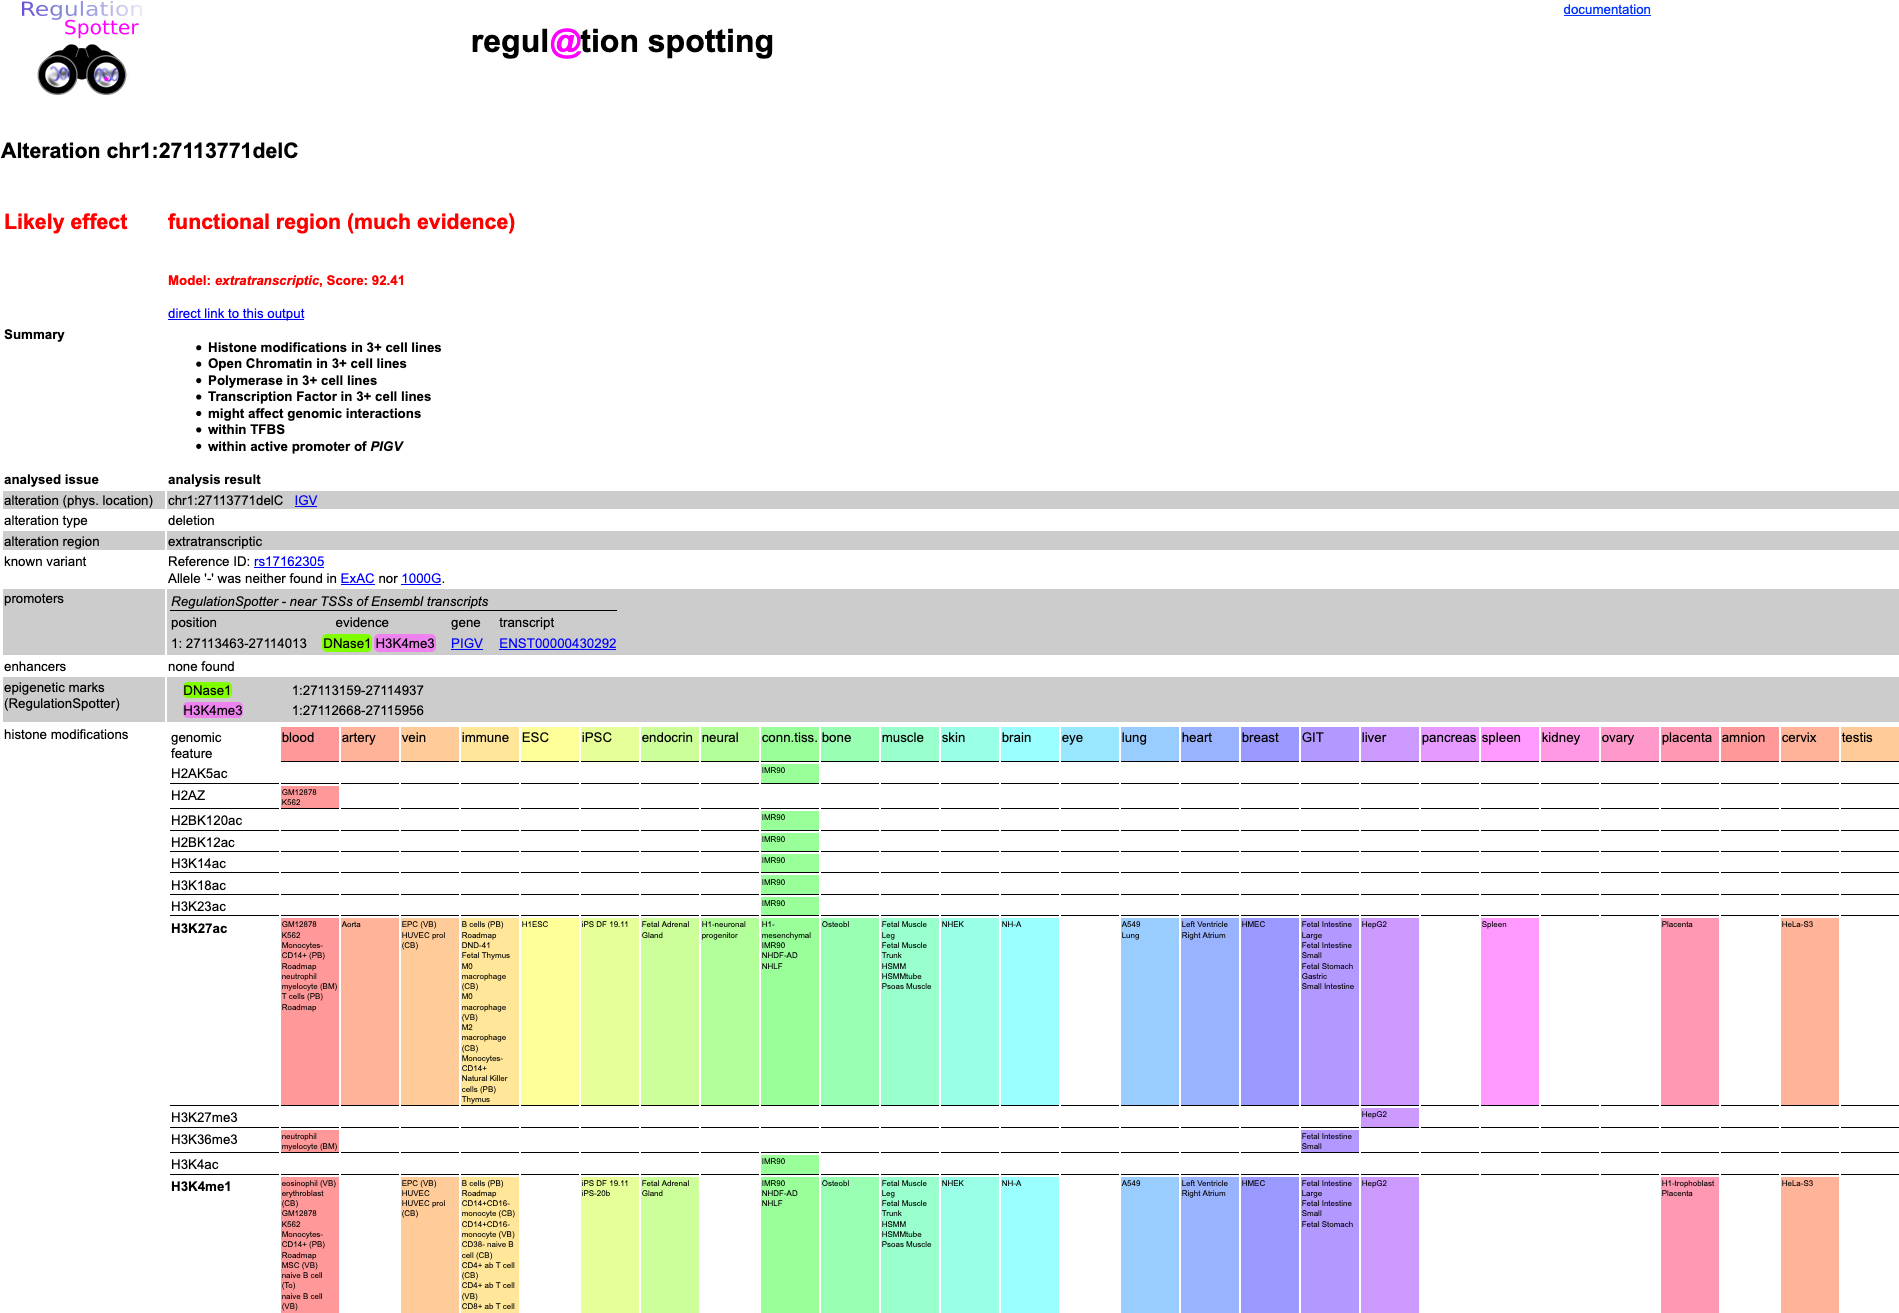 Screenshot of detailed results view of RegulationSpotter analysis of a single variant.
Results
Likely effect of an alteration
RegulationSpotter treats alterations differently depending on whether they are located within a gene or not. For alterations in protein-coding transcripts of genes, it relies on MutationTaster, which classifies an alteration as one of four possible types:Alteration (phys. location)
The alteration on "physical" i.e. chromosomal level (e.g. chr7:91623937_91623938insGGCAAT).Alteration type
Is either SNV (a single base exchange), an insertion, a deletion or a combination of insertion and deletion.Alteration region
Extratranscriptic by definition. Extratranscriptic in this context means any position that is out of (protein coding) transcripts, i.e. also promoter regions upstream of the gene start (the 5' most TSS). Any known polymorphism(s) or known disease variant that have been found at the position in question. Our database contains all single nucleotide polymorphisms (SNPs) from the NCBI SNP database (dbSNP). If an alteration is located at the same position as a known dbSNP, RegulationSpotter provides the SNP ID (or rs ID) and a link. Please note that there may be differences between your alteration and the alleles in dbSNP.Promoters
This section displays all the promoters annotated for your variant. RegulationSpotter gets this information from various sources:Enhancers
Displays all enhancer annotations found for your variant. Enhancer annotations were obtained from FANTOM5 [5] and VISTA [6]Epigenetic Marks (RegulationSpotter)
Epigenetic marks (DNase1 hypersensitive sites and H3K4me3 annotations) obtained from Ensembl multicell regulatory features which were FOUND (alternativ: are annotated) in at least 3 cell lines and overlap with a promoter region. Please keep in mind that the coordinates of these marks may differ from the marks directly taken from the Ensembl Regulatory Build, because we show the overlap between different cell lines. This allows for a sharper annotation than in the Ensembl Regulatory Features Promoter and Promoter flanking region, but is less detailed than the cell-based single track annotations.Histone Modifications, Polymerase, Open Chromatin, Transcription Factor Binding Site
We obtained cell-based annotations on histone modifications, polymerase binding sites, open chromatin and transcription factor binding sites (TFBSs) from the Ensembl regulatory build [3].Histone Modifications
We used annotations for the following 28 histone modifications from the Ensembl regulatory build:| H2AK5ac | Histone 2A Lysine 5 Acetylation |
| H2AZ | Histone 2A variant Z |
| H2BK120ac | Histone 2B Lysine 120 Acetylation |
| H2BK12ac | Histone 2B Lysine 12 Acetylation |
| H2BK15ac | Histone 2B Lysine 15 Acetylation |
| H2BK20ac | Histone 2B Lysine 20 Acetylation |
| H2BK5ac | Histone 2B Lysine 5 Acetylation |
| H3K14ac | Histone 3 Lysine 14 Acetylation |
| H3K18ac | Histone 3 Lysine 18 Acetylation |
| H3K23ac | Histone 3 Lysine 23 Acetylation |
| H3K23me2 | Histone 3 Lysine 23 di-methylation |
| H3K27ac | Histone 3 Lysine 27 Acetylation |
| H3K27me3 | Histone 3 Lysine 27 Tri-Methylation |
| H3K36me3 | Histone 3 Lysine 36 Tri-Methylation |
| H3K4ac | Histone 3 Lysine 4 Acetylation |
| H3K4me1 | Histone 3 Lysine 4 Mono-Methylation |
| H3K4me2 | Histone 3 Lysine 4 Di-Methylation |
| H3K4me3 | Histone 3 Lysine 4 Tri-Methylation |
| H3K56ac | Histone 3 Lysine 56 Acetylation |
| H3K79me1 | Histone 3 Lysine 79 mono-methylation |
| H3K79me2 | Histone 3 Lysine 79 di-methylation |
| H3K9ac | Histone 3 Lysine 9 Acetylation |
| H3K9me1 | Histone 3 Lysine 9 mono-methylation |
| H3K9me3 | Histone 3 Lysine 9 Tri-Methylation |
| H4K20me1 | Histone 4 Lysine 20 mono-methylation |
| H4K5ac | Histone 4 Lysine 5 Acetylation |
| H4K8ac | Histone 4 Lysine 8 Acetylation |
| H4K91ac | Histone 4 Lysine 91 Acetylation |
Open Chromatin
For annotation of open chromatin, we used DNase I hypersensitive sites from the Ensembl regulatory build.Polymerase Binding Sites
Indicates that annotations for Polymerase II and Polymerase III were found for your variant's location.Transcription Factor Binding Sites
We included the following TFBSs (see list below). TFBSs that are annotated in at least 3 different cell lines are printed in bold. TFBSs can be either confirmed, i.e. found by experimental procedures such as ChIP-seq, or be deduced by motif, i.e. the binding site for a certain TF that can be contained in the DNA sequence.| Ap2alpha | Ap2alpha Transcription Factor Binding |
| Ap2gamma | Ap2gamma Transcription Factor Binding |
| ATF3 | ATF3 Transcription Factor Binding |
| BAF155 | BAF155 Transcription Factor Binding |
| BAF170 | BAF170 Transcription Factor Binding |
| BATF | BATF Transcription Factor Binding |
| BCL11A | BCL11A Transcription Factor Binding |
| BCL3 | BCL3 Transcription Factor Binding |
| BCLAF1 | BCLAF1 Transcription Factor Binding |
| BHLHE40 | BHLHE40 Transcription Factor Binding |
| Brg1 | Brg1 Transcription Factor Binding |
| Cfos | Cfos TF binding |
| Cjun | Cjun TF binding |
| Cmyc | Cmyc TF binding |
| CTCF | CCCTC-binding factor |
| CTCFL | CTCFL Transcription Factor Binding |
| E2F1 | E2F1 Transcription Factor Binding |
| E2F4 | E2F4 Transcription Factor Binding |
| E2F6 | E2F6 Transcription Factor Binding |
| EBF1 | EBF1 Transcription Factor Binding |
| Egr1 | Egr1 Transcription Factor Binding |
| ELF1 | ELF1 Transcription Factor Binding |
| ETS1 | ETS1 Transcription Factor Binding |
| FOSL1 | FOSL1 Transcription Factor Binding |
| FOSL2 | FOSL2 Transcription Factor Binding |
| FOXA1 | FOXA1 Transcription Factor Binding |
| FOXA2 | FOXA2 Transcription Factor Binding |
| Gabp | Gabp TF binding |
| Gata1 | Gata1 TF binding |
| Gata2 | Gata2 Transcription Factor Binding |
| GTF2B | GTF2B Transcription Factor Binding |
| HDAC2 | HDAC2 Transcription Factor Binding |
| HDAC8 | HDAC8 Transcription Factor Binding |
| HEY1 | HEY1 Transcription Factor Binding |
| HNF4A | HNF4A Transcription Factor Binding |
| HNF4G | HNF4G Transcription Factor Binding |
| Ini1 | Ini1 Transcription Factor Binding |
| IRF4 | IRF4 Transcription Factor Binding |
| Junb | Junb Transcription Factor Binding |
| Jund | Jund TF binding |
| Max | Max TF binding |
| MEF2A | MEF2A Transcription Factor Binding |
| MEF2C | MEF2C Transcription Factor Binding |
| Nanog | Nanog Transcription Factor Binding |
| Nfe2 | Nfe2 TF binding |
| NFKB | NFKB Transcription Factor Binding |
| NR4A1 | NR4A1 Transcription Factor Binding |
| Nrf1 | Nrf1 Transcription Factor Binding |
| Nrsf | Nrsf TF binding |
| p300 | p300 Transcription Factor Binding |
| Pax5 | Pax5 Transcription Factor Binding |
| Pbx3 | Pbx3 Transcription Factor Binding |
| POU2F2 | POU2F2 Transcription Factor Binding |
| POU5F1 | POU5F1 Transcription Factor Binding |
| PU1 | PU1 Transcription Factor Binding |
| Rad21 | Rad21 Transcription Factor Binding |
| RXRA | RXRA Transcription Factor Binding |
| SETDB1 | SETDB1 Transcription Factor Binding |
| Sin3Ak20 | Sin3Ak20 Transcription Factor Binding |
| SIX5 | SIX5 Transcription Factor Binding |
| SP1 | SP1 Transcription Factor Binding |
| SP2 | SP2 Transcription Factor Binding |
| Srf | Srf TF binding |
| TAF1 | TAF1 Transcription Factor Binding |
| TAF7 | TAF7 Transcription Factor Binding |
| Tcf12 | Tcf12 Transcription Factor Binding |
| THAP1 | THAP1 Transcription Factor Binding |
| Tr4 | Tr4 Transcription Factor Binding |
| USF1 | USF1 Transcription Factor Binding |
| XRCC4 | XRCC4 Transcription Factor Binding |
| Yy1 | Yy1 Transcription Factor Binding |
| ZBTB33 | ZBTB33 Transcription Factor Binding |
| ZBTB7A | ZBTB7A Transcription Factor Binding |
| ZEB1 | ZEB1 Transcription Factor Binding |
| Znf263 | Znf263 TF binding |
| ZNF274 | ZNF274 Transcription Factor Binding |
Genomic Interactions
We integrated data on the interaction of distant genomic elements generated by Hi-C experiments from Rao et al. [7], from 5C experiments for the ENCODE project [8,9] generated by groups from the University of Massachusetts and from the 4D Genome database. 5C and Hi-C data were downloaded from NCBI: Find 5C data UMass data here and Hi-C data here .Interaction plot
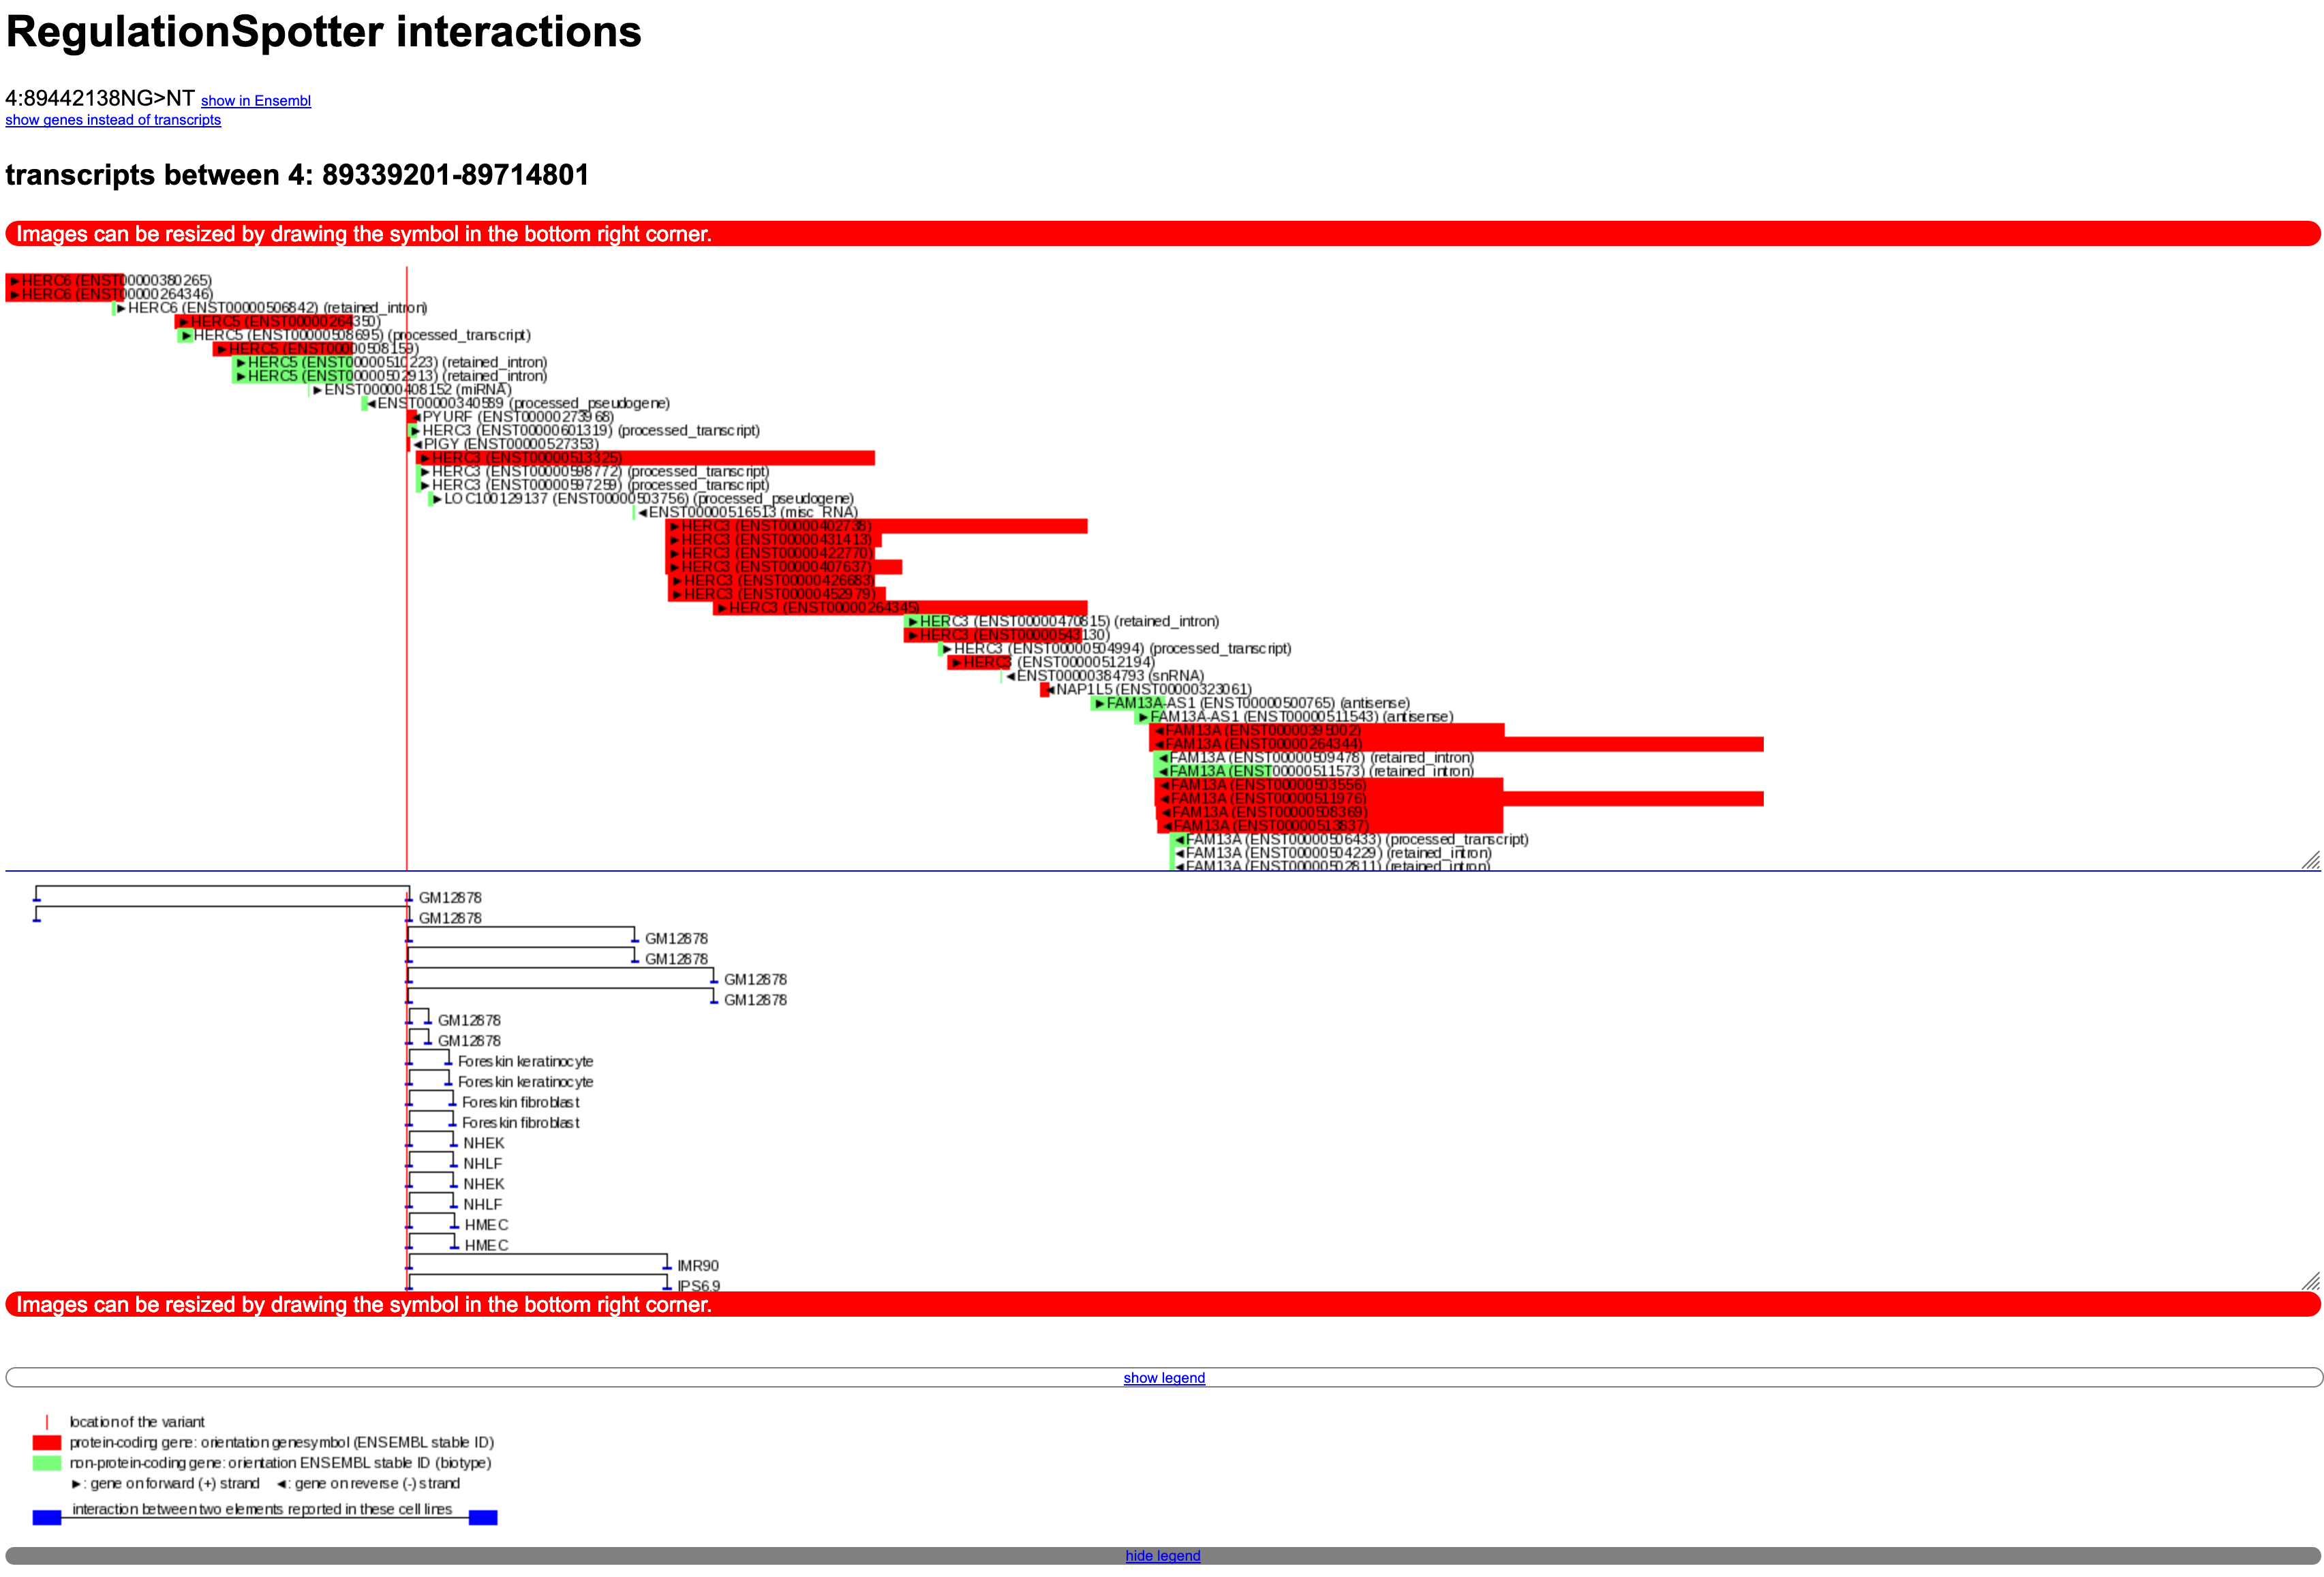 Screenshot of an interaction plot.
This plot is embedded in the single variant output (example - click on 'show interactions as plot', direct link to the interaction plot).
Screenshot of an interaction plot.
This plot is embedded in the single variant output (example - click on 'show interactions as plot', direct link to the interaction plot).
PhyloP/PhastCons
Indicates the conservation of the alteration site. Data from phyloP [10] and PhastCons [11].CADD
The CADD [12] value for the respective position. Please be aware that we always display the highest value for a certain position, regardless of the actual variant, which means that the CADD value displayed here might slighty differ from the actual value for the distinct variant stored or displayed elsewhere. Moreover, CADD values are only displayed for informational reasons and are not included in the score. The integrated version is CADD for b37 v1.3.Chromosome
The chromosome the alteration is located on.Strand
Is either 1 for forward strand or -1 for reverse strandChromosomal position
Gives the last wild-type base before alteration and first wild-type base after alteration in chromosomal sequence context (position relative to start of chromosomal reference sequence) e.g. 154,372,337 / 154,372,339, the altered base is at position 154,372,338.Original chrDNA sequence snippet
Original DNA sequence with the original nucleotide marked in blue.Altered chrDNA sequence snippet
Altered DNA sequence with the original nucleotide marked in blue.Speed
The speed that was required for the current analysis.