In our tutorial, we will exemplarily lead you through RegulationSpotter's analysis of sequencing results. As you can see on the home page, you can query RegulationSpotter in two different ways:
If you are interested in a single regulatory variant, you can query it simply by clicking on the query single variant square and then by entering its genomic location (GRCh37). If you have a vcf file containing a large number of variants,
you can upload it by clicking on the upload vcf file square, which will lead you to RegulationSpotter's upload interface.
Example case: hepatic vein thrombosis and seizure patient
In our example, a patient presenting with portal and hepatic vein thrombosis and seizures is suspected to suffer from a
glycosylphosphatidylinositol deficiency. A panel sequencing with all genes known to cause human hereditary diseases including
up- and downstream extragenic regions was carried out. To improve the chances of finding the causative mutation, candidate genes
were determined based on the condition of the presenting patient and the sequencing results were filtered to exclude variants located in other genes.
The candidate genes for our case were:
PIGV, PIGN, PIGA, PIGL, PIGO, PIGT, PGAP2, PGAP1, PGAP3, PIGW, PIGY, PIGG and PIGM.
The initial analysis included inspection of variants located in protein coding transcripts with a focus on
non-synonymous variants leading to a premature stop codon or a frameshift, or at least an amino acid exchange.
Let's start with querying a single variant!
Analysing a single variant
Unfortunately, after doing the analysis mentioned above, you have not been able to identify the disease-causing mutation
amongst the protein coding variants. Although there are some non-synonymous variants predicted as disease-causing
in your data, their causality can not be sufficient explained. Thus, you have to further look for suspicious variants. A variant located on chromosome 1 catches your eye. The genomic location is chr1:160001799, and it is a G>C SNP. You have found it in ClinVar
as a known disease causing mutation and suspect that it might be a regulatory mutation for one of your candidate genes. Maybe RegulationSpotter can tell you something more
about the alteration?
Starting with RegulationSpotter's
home page, please just click on the
query single variant box.
It will lead you to our
single query interface, where you can enter the genomic location (GRCh37) of the variant:
Please, simply enter the chromosome (1), the position (160001799), the reference allele (G) and the alternative allele (C) and hit
continue. Easy, huh?
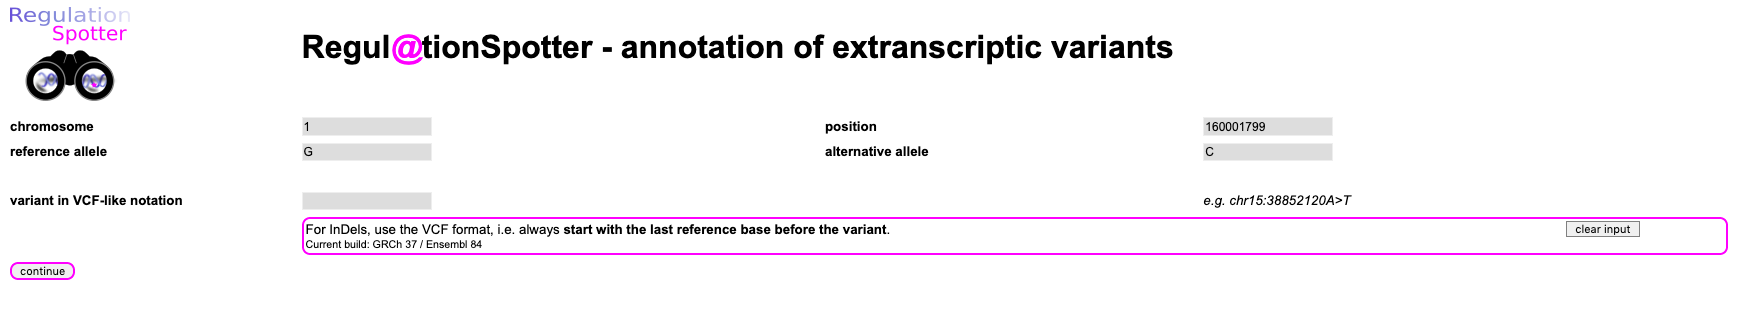 Screenshot of the input for querying a single variant.
If you encounter any problems in entering the above information, you can also directly click
here.
RegulationSpotter will now run for a couple of seconds. Once it is done, you will find all sorts of information on the variant in a table format.
Here, you can find RegulationSpotters decision about the variant - in this case, it is
disease causing as the mutation is a known disease mutation in ClinVar (which you can also see in the
known variant section).
Moreover, RegulationSpotter shows you everything it knows about the variant at the given location. To read up more about
the information provided by RegulationSpotter, feel free to refer to our
documentation.
In this case, RegulationSpotter is able to list a whole lot of data:
It knows that the alteration is located in a Promoter according to Ensembl multicell regulatory features, a DNase1 hypersensitive
site in a promoter, a H3K4me3 site in a promoter and so on. In addition, the conservation at the site is relatively high. Thus - independently of the fact that the mutation is known to be disease causing -
taken together, the information points at a regulatory function.
 Screenshot of the first part of detailed results output for a single variant.
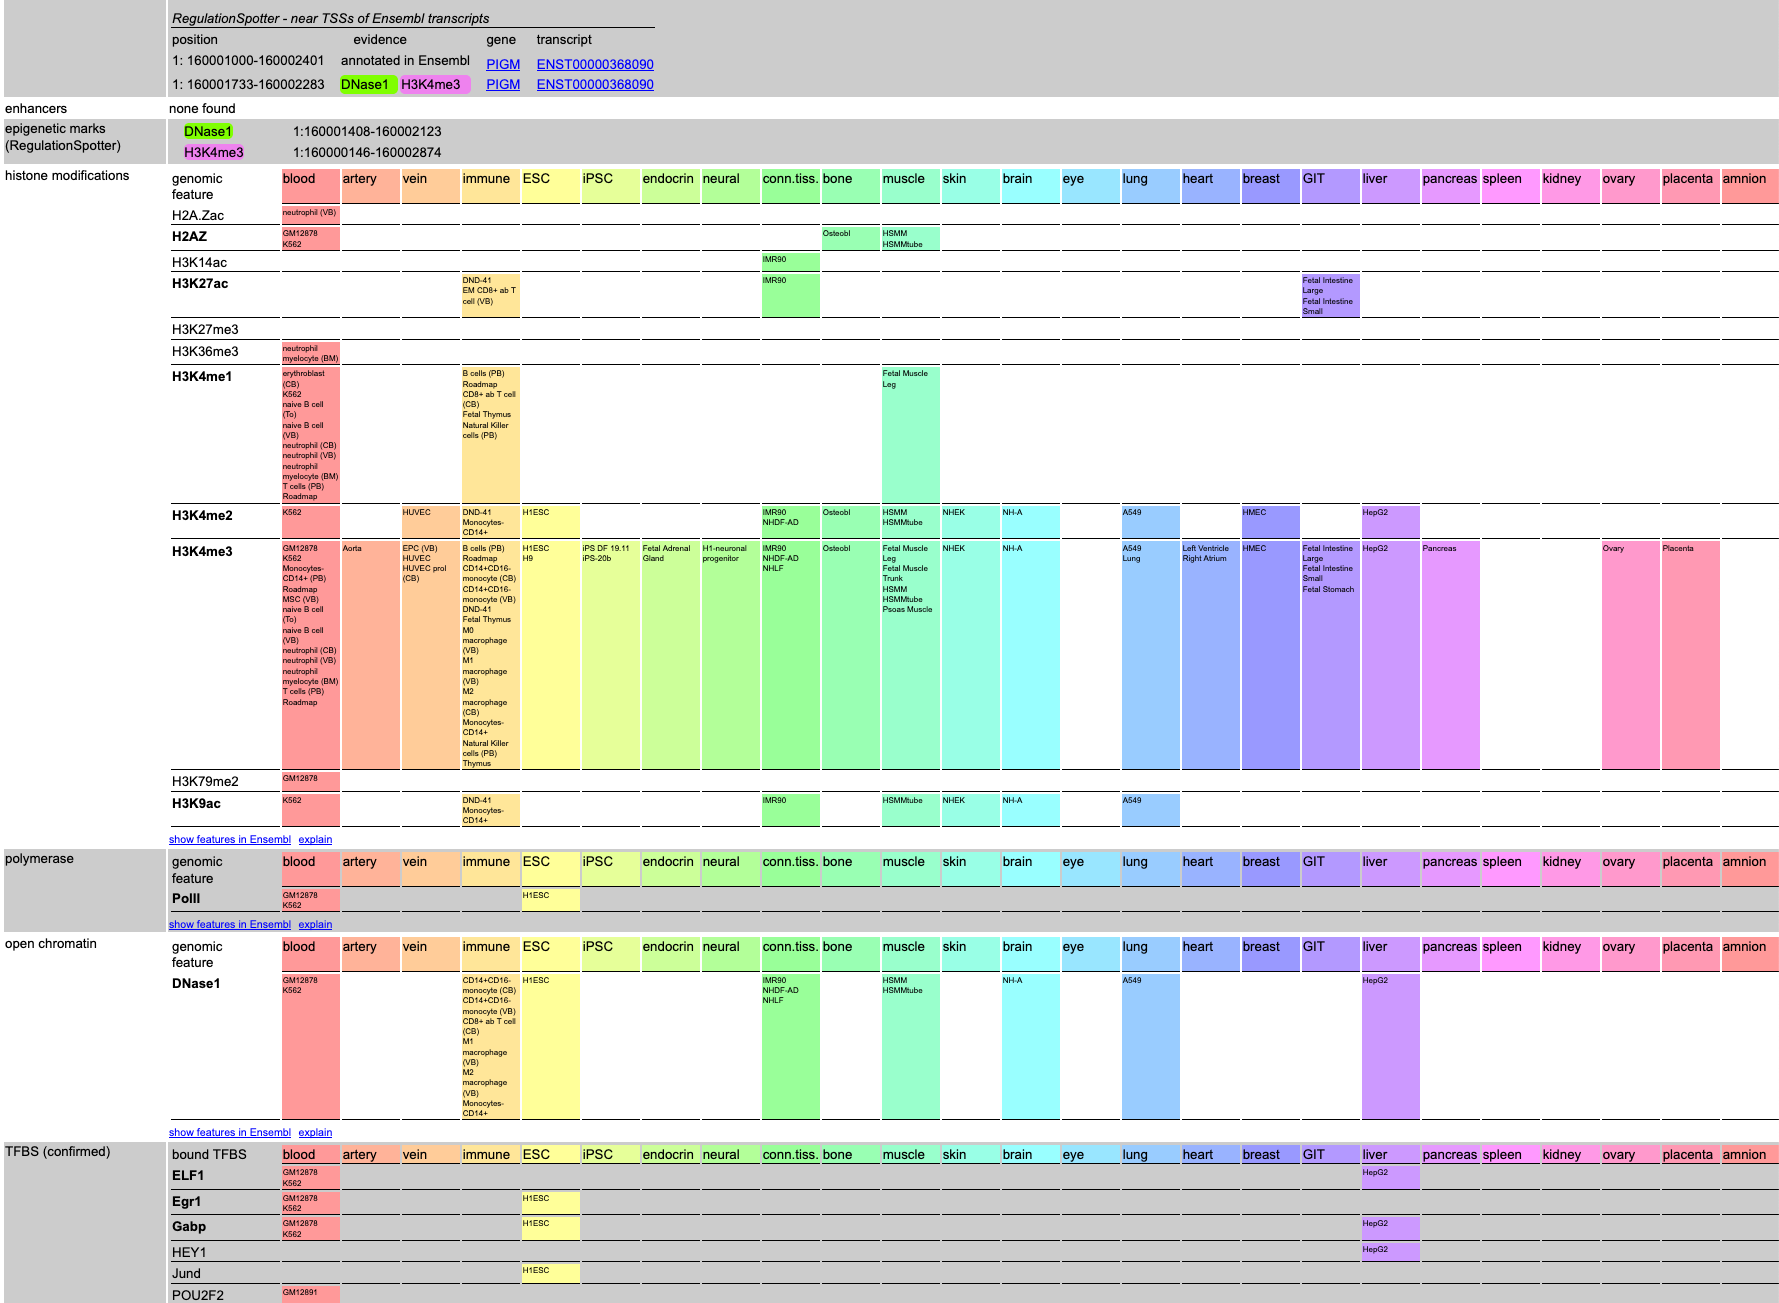 Screenshot of the second part of detailed results output for a single variant.
Analysing a vcf file
Now, let's switch to RegulationSpotter's second analysis mode - analysing an entire vcf file.
As you remember, in our hypothetical case, we have already analysed intragenic variants in the list of candidate genes but did not find a convincing disease-causing mutation.
Hence, we assume that the disease is caused by a mutation in a regulatory region and decide to examine our vcf file with RegulationSpotter.
vcf file
Let's go back to RegulationSpotter's
home page. This time, please click on the
upload vcf file box, which brings you to our
upload page. Here, you can find the vcf file (small blue link, upper right area of the page saying
sample file).
Please save it on your computer and then upload it to RegulationSpotter.
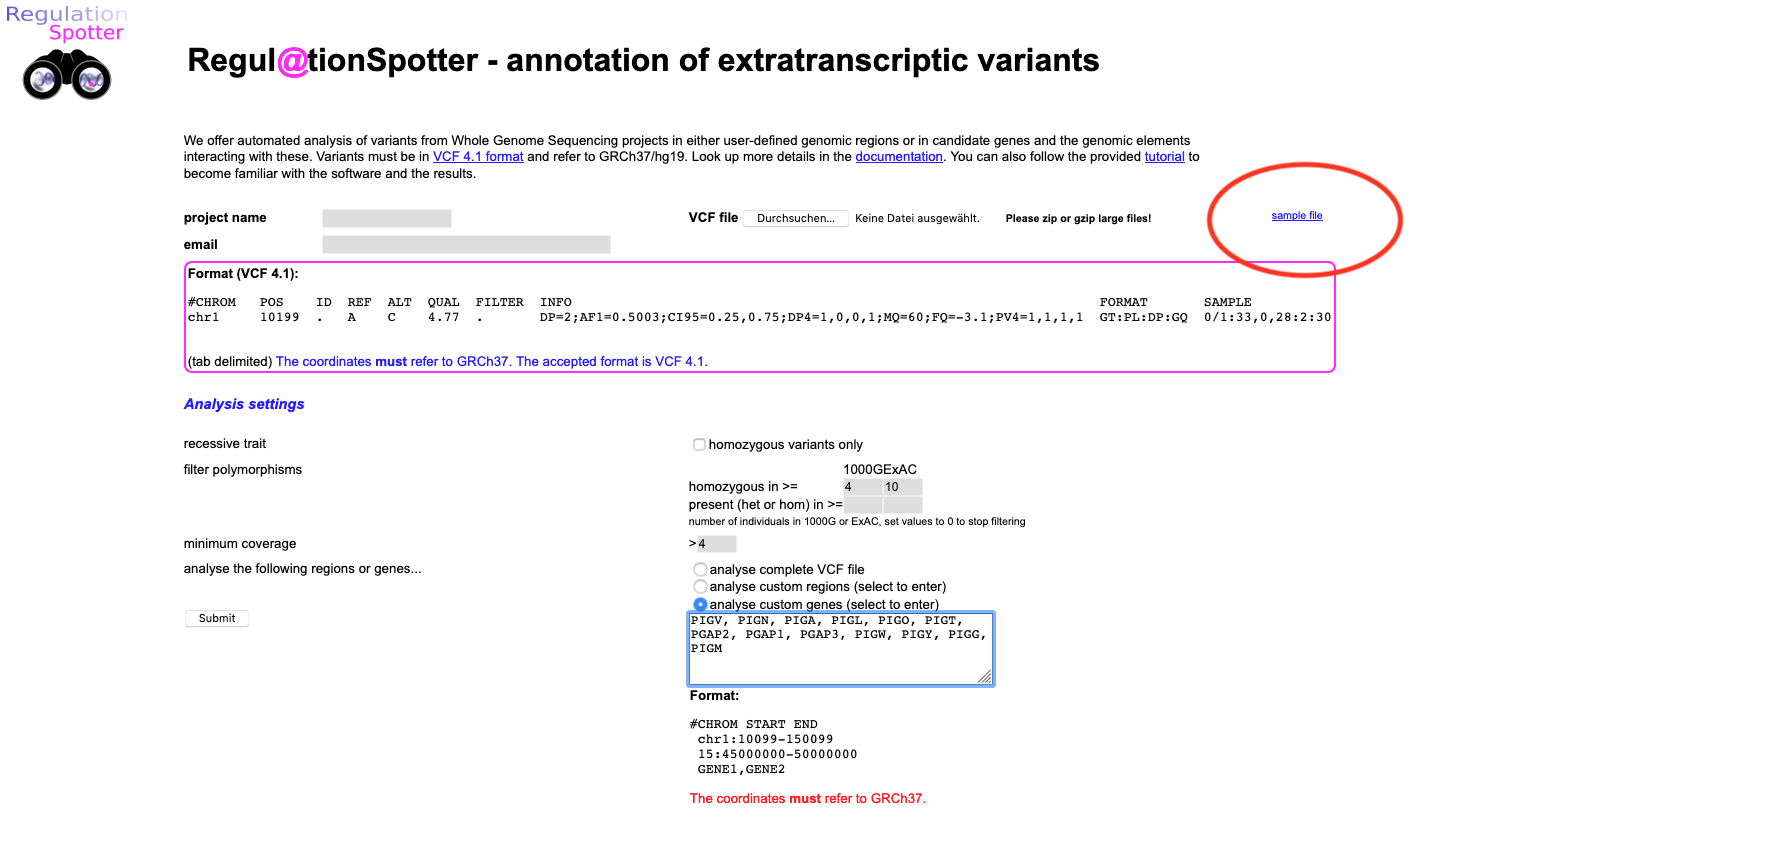 Screenshot of the web page to upload a vcf file to RegulationSpotter.
In this file, you can find all the variants which in our assumed sequencing project were found in the panel genes. Additionally, you can find some regulatory variants there as well,
which we believe could be involved in the development of the disease.
Of course, most of this genetic variation is most likely harmless, but we expect one of the alterations to be causative for the disease.
Analysis settings
When uploading the vcf file, you can specify a number of settings for the analysis.
For our purposes, please stick with the default settings.
Analyse the following regions or genes
In a typical case, you might end up with a rather large vcf file, especially if you are looking at entire exomes or genomes. Therefore, you would usually
start with rather stringent filtering options.
In our tutorial, the vcf file is rather small to decrease waiting times for you. However, it still makes sense
to restrict the analysis to the list of candidate genes.
Thus, please select enter our candidate genes in the restrict to these genes text area (copy/paste is fine, see screenshot above for the text area to paste in) :
PIGV, PIGN, PIGA, PIGL, PIGO, PIGT, PGAP2, PGAP1, PGAP3, PIGW, PIGY, PIGG, PIGM
If you want to know more about the settings options, please refer to our
documentation.
Once you are done, just hit "submit" and wait for RegulationSpotter to work on your file.
If you should have trouble with uploading the vcf
or do for whatever reason not arrive at the results, you can directly click
here.
Synopsis and display settings
RegulationSpotter will lead you now to its first landing page.
A synopsis of submitted and analysed variants can be shown on demand by clicking on the show / hide statistics link
at the top and bottom of the page (see screenshot below). Most often, RegulationSpotter will not analyse each and every line of your VCF file, either because you have set certain filters,
or because certain variants were not suitable for analysis with RegulationSpotter. The synopsis gives you an idea of how your analysis went.
For detailed information on this page, please also refer to our documentation.
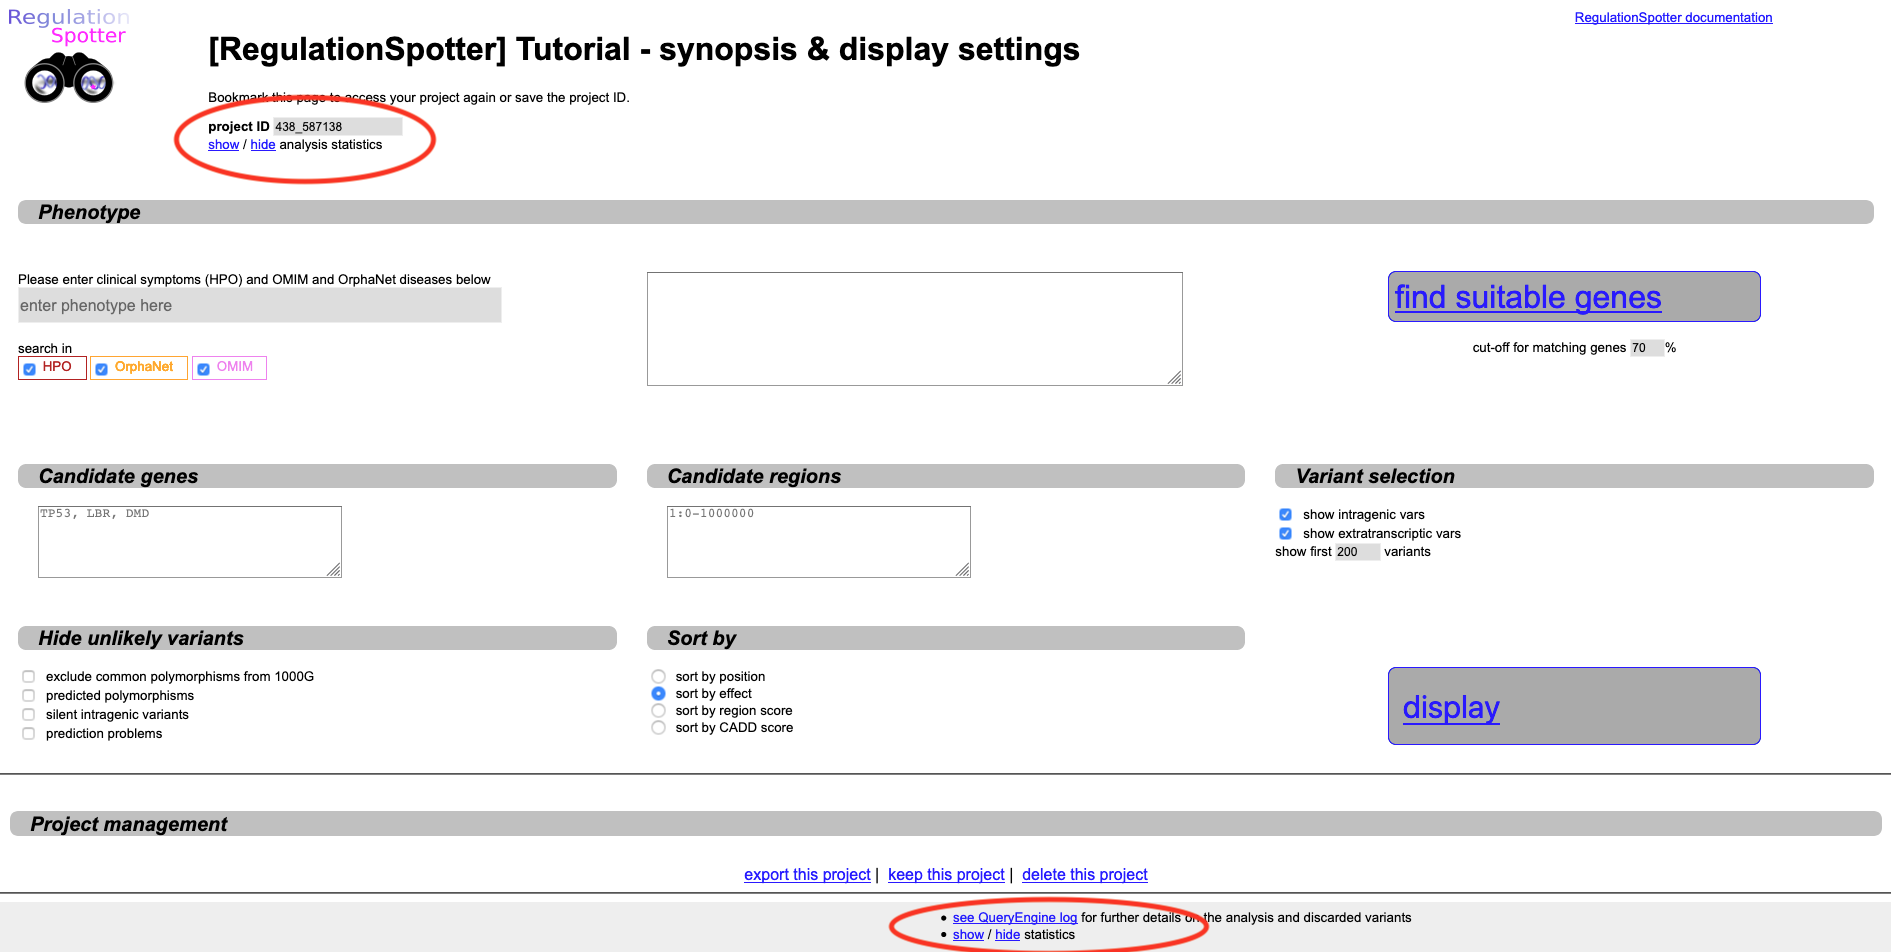
Screenshot of the landing page after analysing a vcf file with RegulationSpotter.
If you are planning to access your project later on, please record your project ID and / or the URL to your project (displayed in the browser address field). This enables you to
simply enter it whenever you want to have a look at your results again.
Display settings
Here, you can filter and sort your results for display. In a real-life case, you would most likely start with a strict filter to avoid being
swamped by your data. Since our tutorial data set is rather small, we initially do not hide any variants.
As we suspect that our causative alteration is located in a regulatory region, we are interested in variants with a high likelihood for
regulatory location.
Therefore, make sure that the default sorting option, 'sort by effect', is selected.
When you are done, just hit display to get your results.
Results
RegulationSpotter first gives you an overview of its findings. In the left, text-based, part you can find all
sort of useful information about single variants, such as chromosomal position, reference and alternative allele, and eventually connected gene(s).
The rest of the summary is a colour-coded matrix indicating different types of intragenic or extra-transcriptic regulatory features which might be affected.
Further information on the summary table can be found in our
documentation.
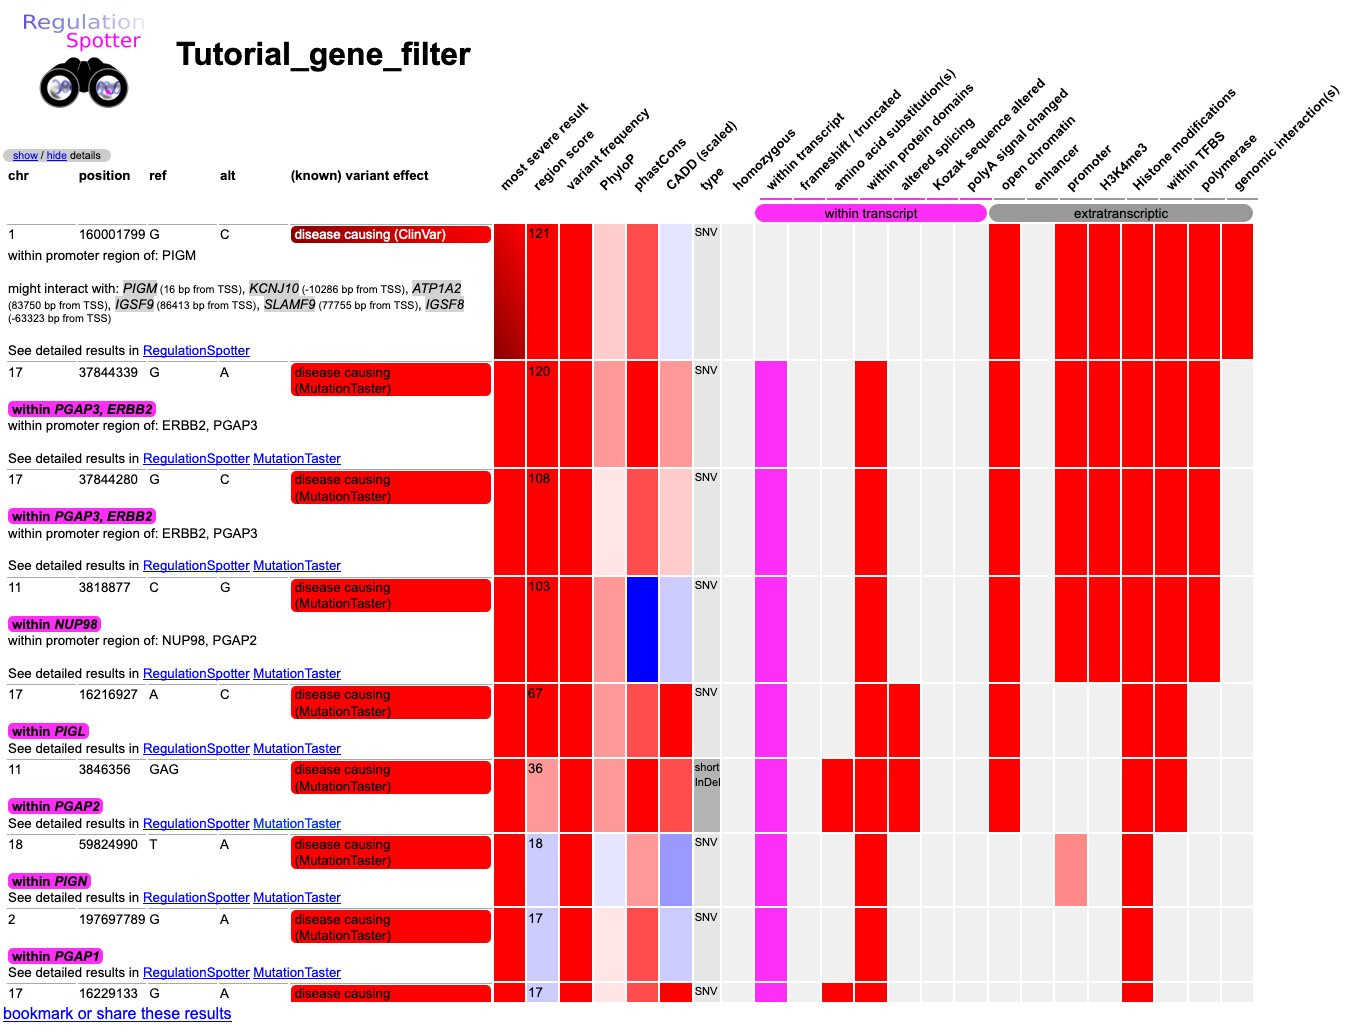 Screenshot of the results matrix after choosing how to display the results of a vcf file analysed with RegulationSpotter.
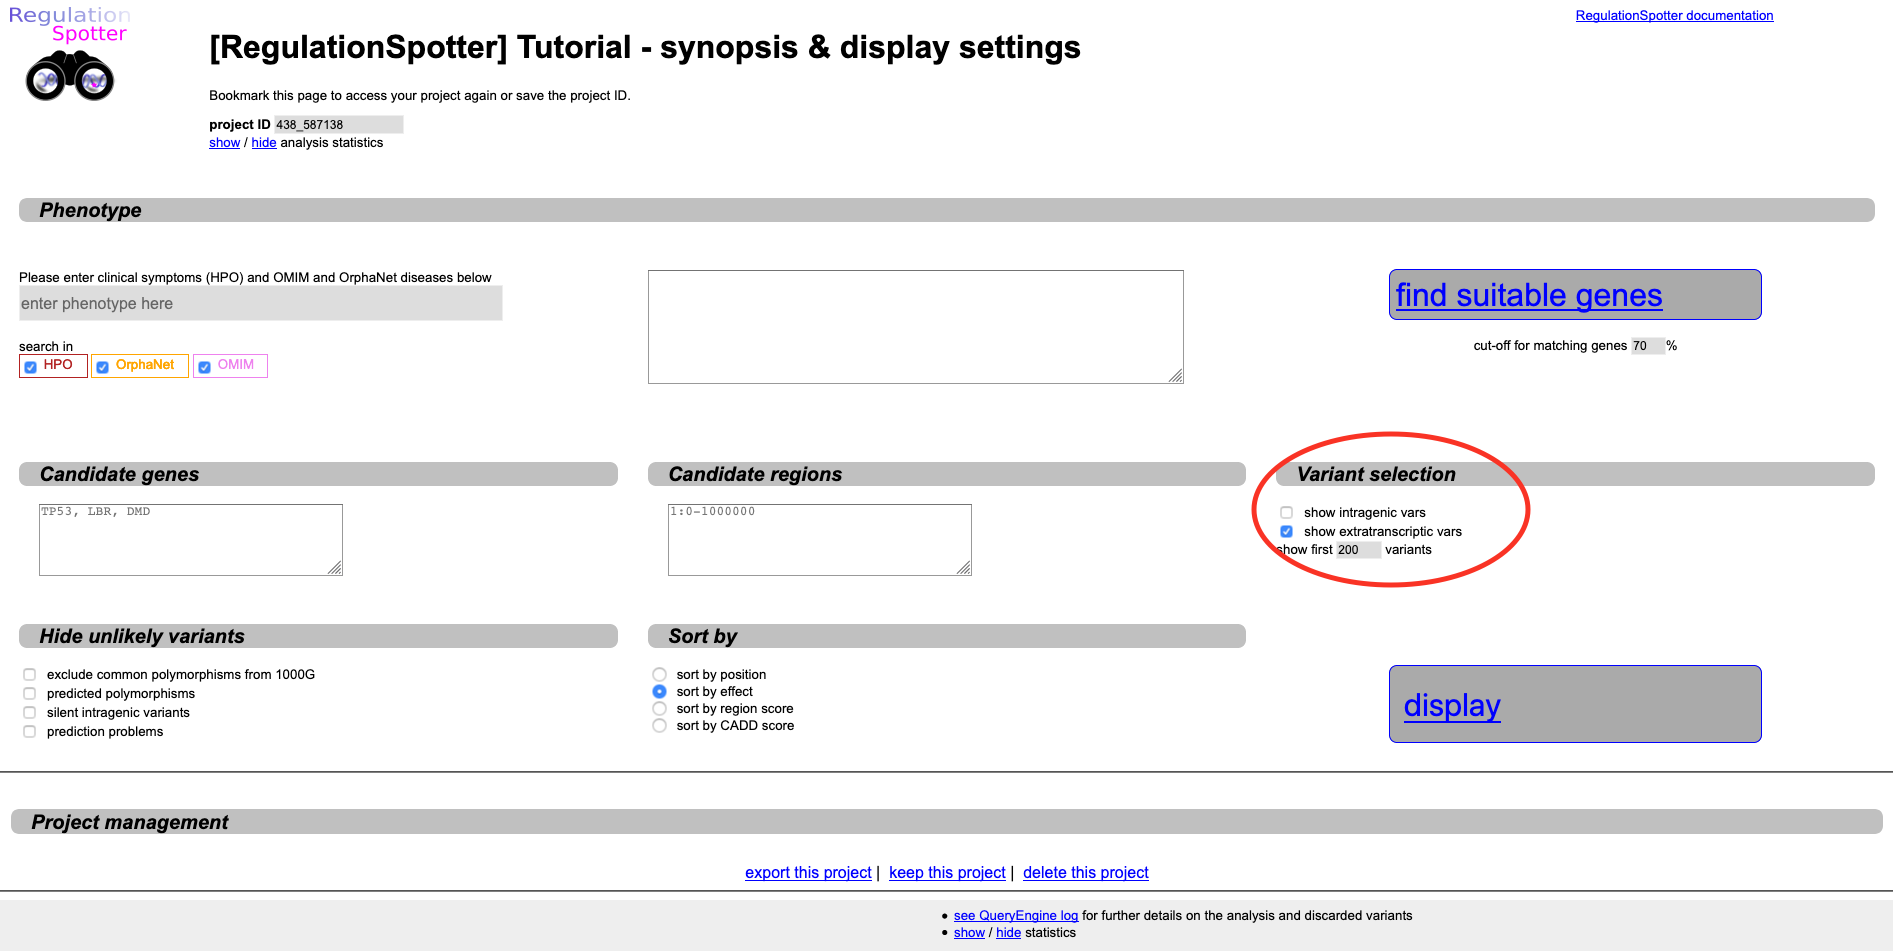
Because we have not hidden any variants, we see intra- as well as extragenic variants. We recognise some of the intragenic
variants in candidate genes (e.g. 17:16229133G>A), but we assume that we already inspected all intragenic variants beforehands,
which is why we can also hide them. Thus, click on the browser tab with the
Display settings page, where you can unselect the
show intragenic vars option in the
Variant selection section.
A new Results matrix opens up in a new tab, which only features extragenic variants.
 Unselect intragenic variants in order to see only extratranscriptic variants.
As we suspect that the causative mutation is located in a regulatory region, first of all we now focus on variants which RegulationSpotter considers to be functional.
This is shown in the
likely effect column.
RegulationSpotter calculates a score dubbed Region Score as a measure for the amount of evidence that a variant is located in a regulatory region.
To calculate this score, RegulationSpotter compiles
and integrates all the information or annotations it can find about the location
of a variant. The higher the score, the more evidence exists for the altered location to be a regulatory region. We will have a closer look
at the top variant:
A G to C SNP at 160001799 on chromosome 1. It might seem familiar to you - it is the alteration we queried in the
single variant section
of the tutorial. This variant is recognised by RegulationSpotter as being disease-causing
because it is annotated as such in ClinVar. Regardless from this annotation, the ReguationSpotter Region Score of 120.64
reflects a high amount of evidence that this variant is located in functionally relevant, regulatory region.
Although there are other extragenic variants that get a higher score (e.g. 4:493013G>A), this variant uniquely unifies
important features such as annotations of regulatory features, strong evolutionary conservation (reflected by high PhastCons/phyloP values)
and classification as disease variant by HGMD. Taken together, we would assume that this mutation is our most likely candidate.
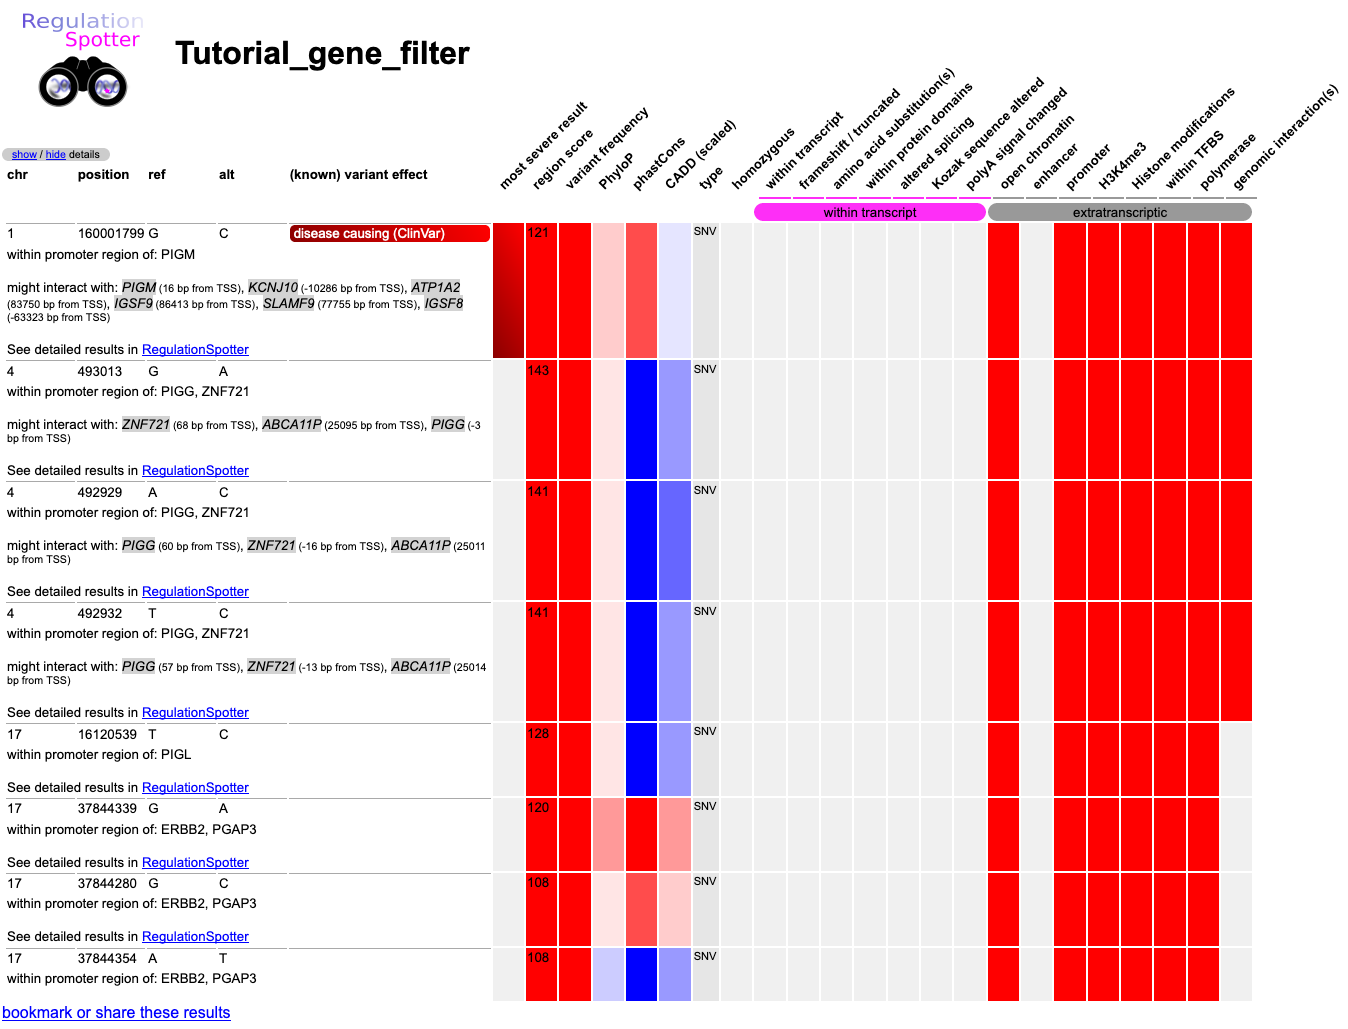 Results matrix after excluding intragenic variants from being displayed.
We can now click on each of these variants to get more information on the regulatory region and end up with the detailed result page we introduced in the
single query section.
For more detailed information on RegulationSpotter's output, please also refer to our
documentation.
Interactions view
Imagine that during your research, you initially analysed the tutorial vcf file without the initial restriction to the above mentioned candidate genes. When watching the results, that you can find
here,
you became interested in another variant in your vcf file. You notice that a C to T SNP located on chromosome 1 at position 27113734
gets a quite high Region Score of 97. It is not located within any of the candidate genes, but according to RegulationSpotter, there seems to be some interaction going on. Let's have a closer look at this!
Please find the variant in RegulationSpotter's list
(for example by searching for position 27113734) and click on
extragenic results to be referred to the detailed results view. For your convenience, you can also follow
this direct link
to arrive at the detailed results for the variant in question.
When scrolling through the detailed results page, you notice that RegulationSpotter considers this variant to be located in a
likely functional region.
Moreover, you receive all sorts of information about what is annotated in various databases and datasets about the location.
(As described above and in our
documentation). Moreover,
RegulationSpotter found interaction data for the location and thus generates a link for you to have this interaction displayed in a graphic.
Please click on
show interactions as plot to try it out, or just find the plot
here.
In the plot (see screenshot below), you will see the variant symbolised as a thin red line. Interaction elements are depicted as black lines with blue ends. You can find genes in the region as red rectangles and pseudogenes marked with a little green box.
You can also switch the view to transcripts instead of genes (attention: this normally produces much more output than the gene view and may take a while, depending on the number of annotated interactions).
Moreover, You will find a link to explore the gene or transcript region in Ensembl. The different parts of the plot (the upper gene/transcript panel and the lower interactions panel) can be resized by clicking on the triangle in the lower right corners.
Below the plot, you can display the legend of the plot by clicking on
show legend.
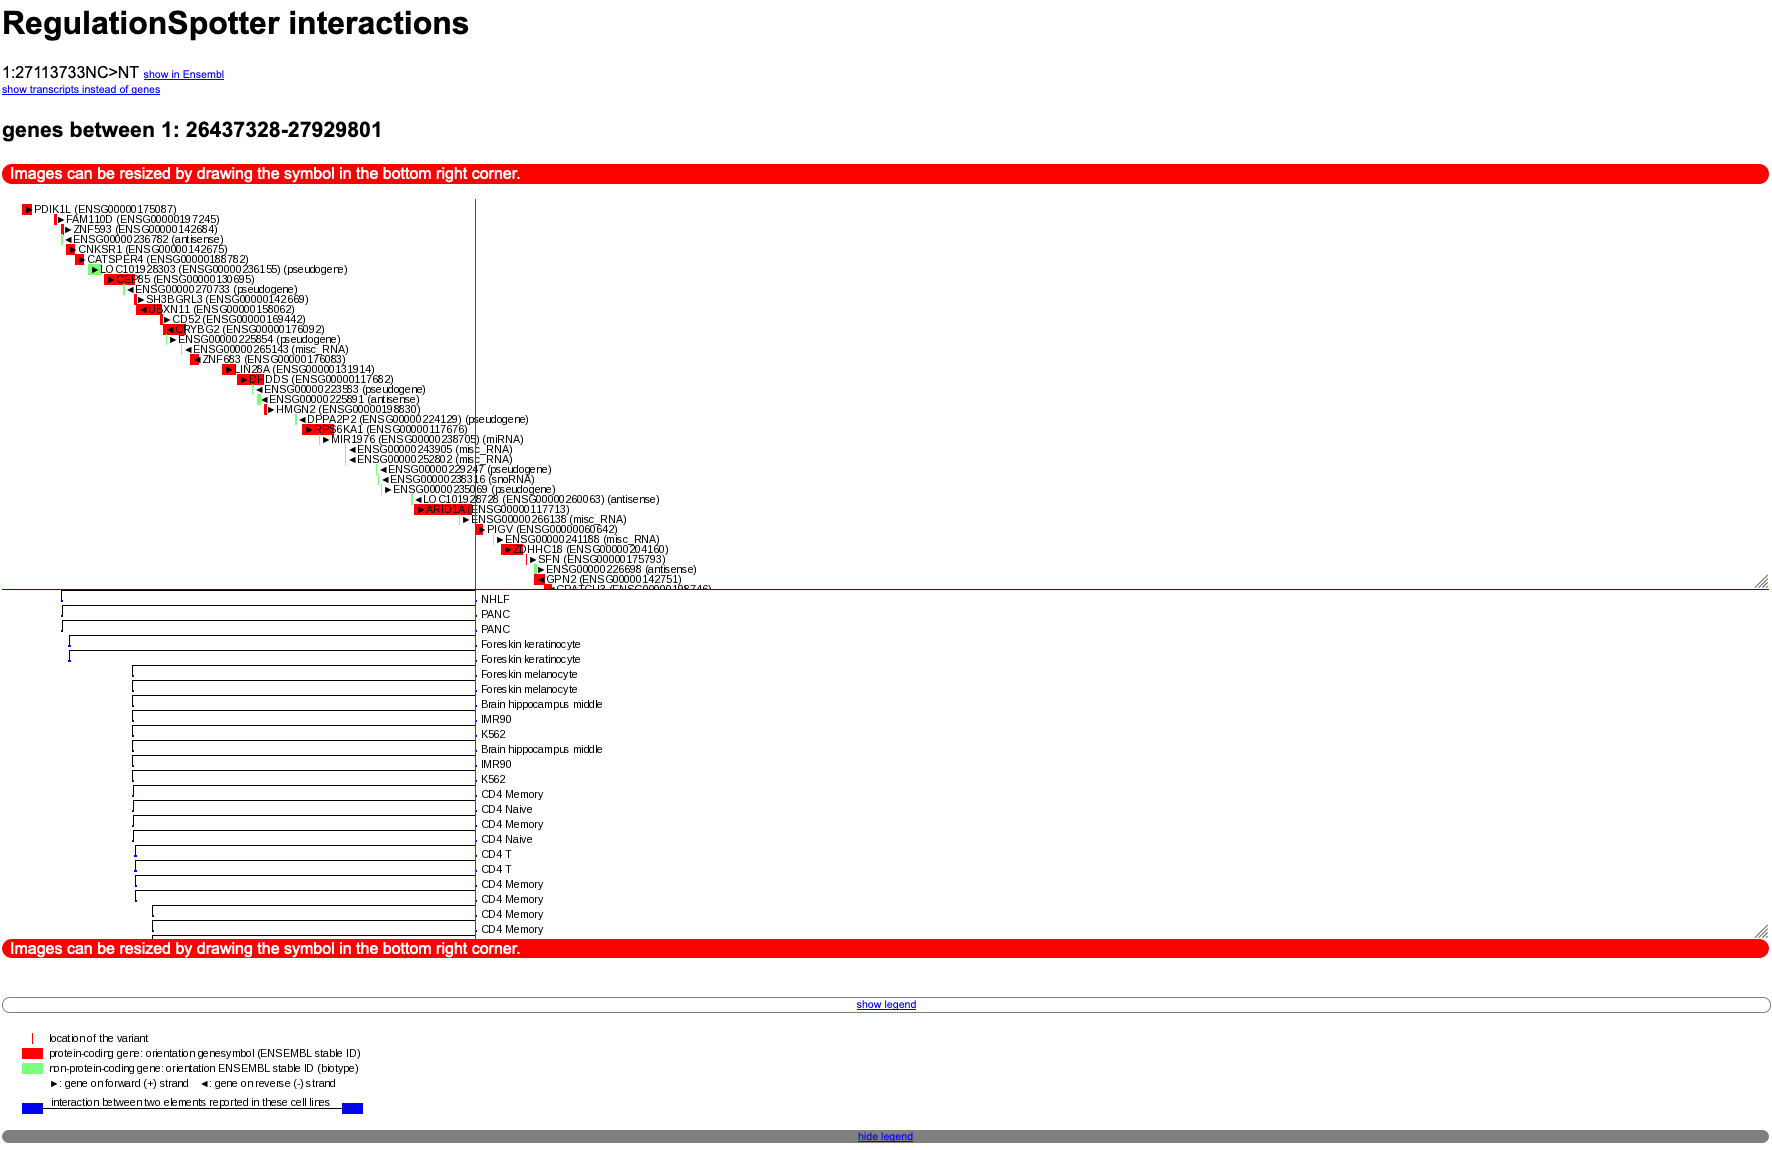 Graphical depiction of interactions between distant genomic elements.
Contact
Now, we hope you have fun with familiarizing yourself with RegulationSpotter! Enjoy playing around with our tutorial data set by trying out different settings.
In case you discover bugs, have suggestions or questions, please write an e-mail to
Jana Marie Schwarz (
jana-marie.schwarz AT charite.de) or to
Dominik Seelow (
dominik.seelow AT charite.de).
We also appreciate hearing about your general experiences using RegulationSpotter.