 |
AboutRegul@tionSpotter |
RegulationSpotter: User-friendly interpretation of extragenic DNA sequence variants
RegulationSpotter is a web-based tool for the interpretation of extragenic DNA variants.
It does not require any bioinformatics skills and is directly aimed at clinicians and researchers. It facilitates translational research projects
without advanced bioinformatics knowledge but with valuable expertise about phenotypes and genes,
a key point in exploiting Whole Genome Sequencing (WGS) data to identify disease mutations.
The tool integrates data from various sources to show whether a variant lies within a regulatory region and has the potential to impair gene expression.
RegulationSpotter allows the user to learn about their variants of interest in a convenient fashion. It visualizes the regulatory importance of a variant and hence enables
researchers to make educated choices about the alterations encountered in WGS data.
Citing RegulationSpotter
If you like RegulationSpotter, please cite us:
RegulationSpotter: annotation and interpretation of extratranscriptic DNA variants.
Schwarz JM, Hombach D, Köhler S, Cooper DN, Schuelke M, Seelow D.
Nucleic Acids Res. 2019 May 20. pii: gkz327. doi: 10.1093/nar/gkz327.
Read the paper!
Work flow
To allow comprehensive analyses, RegulationSpotter accepts both intragenic and extragenic alterations: Intragenic variants, coding or non-coding, are handled by our popular program MutationTaster,
while extragenic variants get assessed by RegulationSpotter directly. There are two ways to get started with RegulationSpotter: It reads variants from standard VCF files and maps them to genes and / or regulatory elements associated with
genes. Moreover users can also simply query single variants. Have a look at RegulationSpotter's workflow below. (Fig. 1)
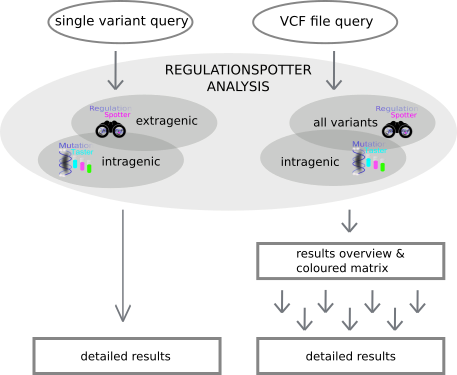
Fig. 1: A depiction of RegulationSpotter's workflow.
The program's comprehensive output combines a summary table with a graphical matrix depicting
key aspects of all analysed variants. The software also provides the option to show more detailed information for every single variant by following the provided hyperlinks.
The intuitive design allows to get a quick yet thorough understanding of a variant's localisation and its possible role in gene regulation.
Variants can be sorted by different parameters, such as phylogenetic conservation, CADD scores, or the RegulationSpotter Xscore. This score reflects the amount of
available evidence that a variant is localised in a regulatory region and might impair its proper function. The analysis can be restricted to variants located in candidate genes,
their promoters, and cis-modifiers.
To get started with RegulationSpotter, have a look at our tutorial. Feel free to contact us if you
encounter any problems.
RegulationSpotter: Statistics and calculation of Region score
Region score
RegulationSpotter generates a score reflecting the
evidence that a variant is located in a functionally relevant region. Each feature is given a specific
weight reflecting the assumed impact of the feature. The score represents the sum of the weights
for all features annotated for a given variant. If one feature is annotated multiple times for the same
variant, it adds up only once to the score. Owing to the low number of real positive 'functional' training variants, we
do not employ machine learning approaches, which require a substantial number of
training cases. Instead, we base the weights on current knowledge and models about the
roles of the different genomic features in gene regulation. The weights are therefore organized as
classes describing the features’ impact on gene regulation (high, medium, low contribution), each
with a different numerical value. By comparing relative risks of appearance of each dichotomous feature in different
data sets of known extratranscriptic disease mutations (P1) versus common extratranscriptic polymorphisms assumed to be harmless (N1),
we optimised the weights assigned to the respective features. See belwo for description of data sets and Fig. 2 for the relative risks.
Due to the low number of cases, we
decided not to adapt weights to the exact risk differences but to rather move features into another
class in case we over- or underestimated their effect. In addition, we chose to regard only features
with at least 7/458 occurrences in training set P1 to avoid spurious scoring. ‘Rare’ transcription
factor binding sites are combined in the pseudo-feature ‘rare TFBS’. Some features are
representative of the same entity (e.g. various promoter annotations from different sources). In
such cases, only the single feature with the highest weight is scored.
In order to find optimal weights for the phylogenetic conservation (phyloP and phastCons), we
iterated through different combinations of values and selected the model that reached the highest
area under the curve for precision/recall. We found that a relatively low contribution of phylogenetic
conservation to the final score yielded the best performance.
To allow a meaningful interpretation of the region score we decided to assess its distribution in a
set of known extratranscriptic disease mutations and harmless extratranscriptic variants. In a
balanced test set (457 disease mutations from training set P1 plus 457 randomly chosen
polymorphisms from N1, we iterated through different region sore thresholds to determine the one
which separates the two groups of variants best from each other. We chose the threshold that
delivered the highest F1-score to be used to display a simple interpretation of the region score.
This can be either ‘non-functional’ (score < 25) or ‘functional’ (score > 25). To provide further information for our users, we
add the label ‘much evidence’ to the result if the score is above (region score > 41) or below (region score < 14) the threshold of
PPV=98% or NPV=98%, respectively.
Data sets
We set up two different data sets with extratranscriptic variants (SNVs and InDels) to deduce the biological and clinical relevance of integrated regulatory features.
The positive data set (P1) contains 457 extratranscriptic disease mutations (tag DM) from the Professional version of HGMD (HGMD Pro®, build 2018/1) and the Genomiser publication (Smedley et al).
The negative data sets (N1) comprises 8,000 randomly chosen common polymorphisms from the 1000 Genomes Project, all present in the homozygous state in more than 10 individuals.
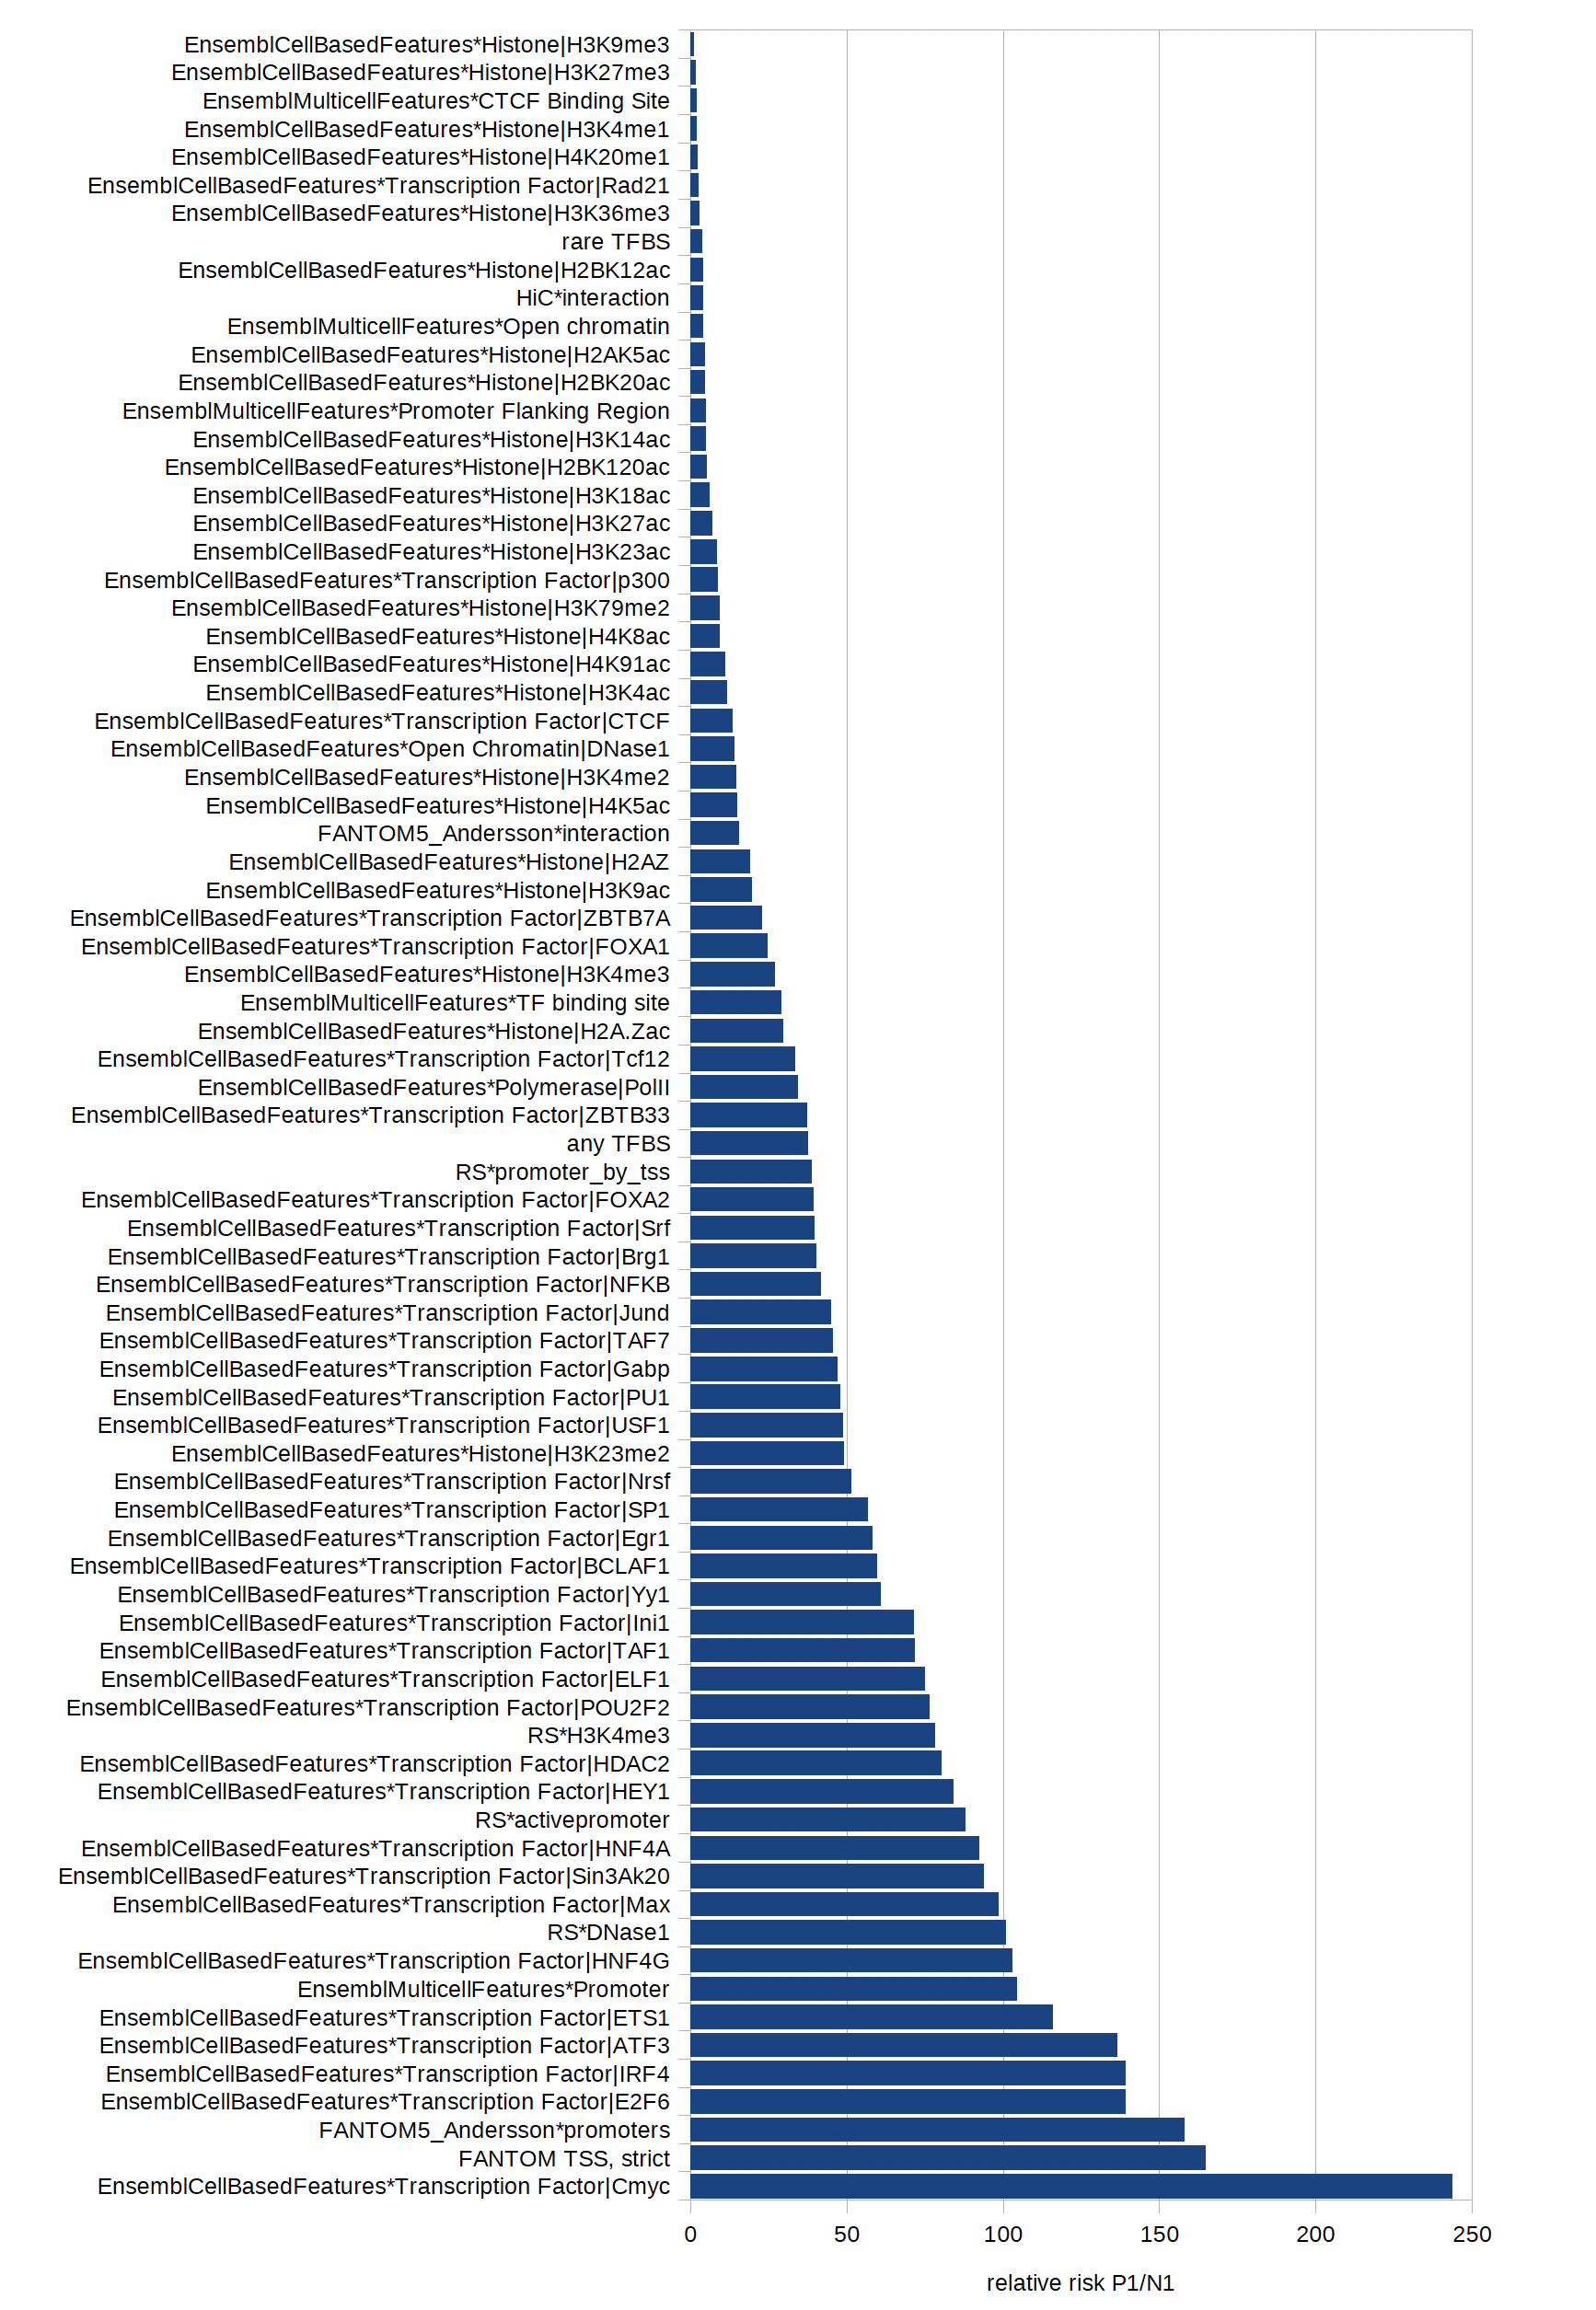
Fig. 2: Relative risks of different features to occur in a data set of extratranscriptic disease mutations versus common polymorphisms.
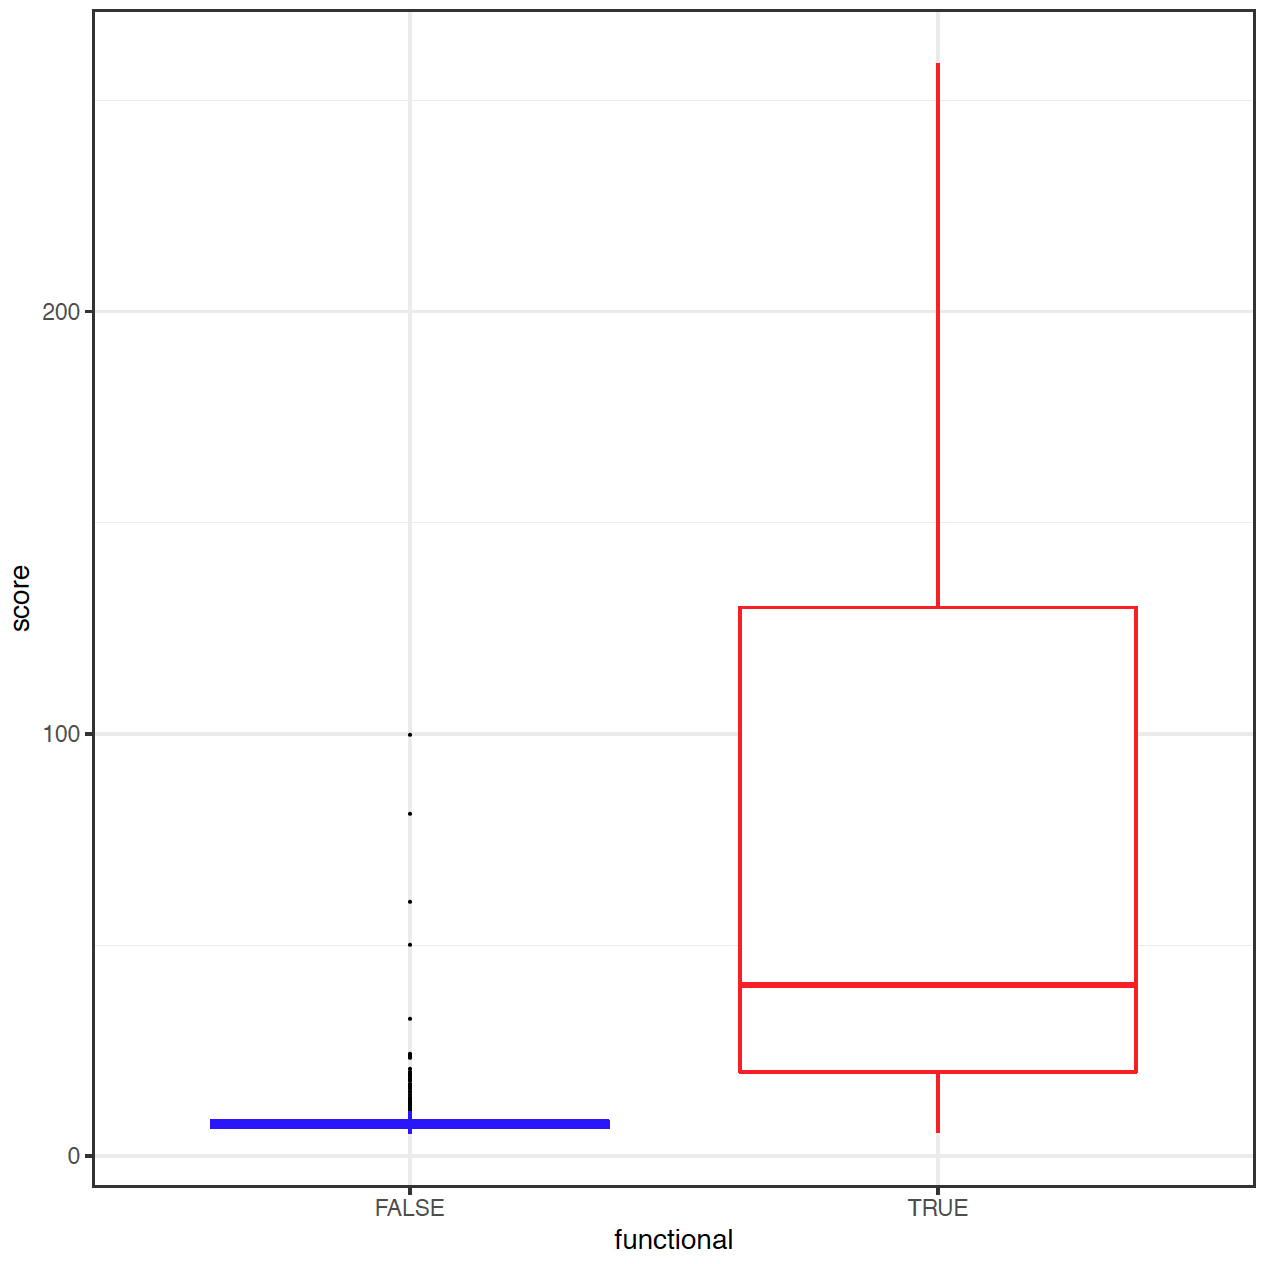
Fig. 3: Distribution of region score in a small testset of 457 extratranscriptic disease mutations from HGMD Professional (true / red) and 457 randomly chosen common polymorphisms (false / blue).